
Back To The Basics: What Is Columnar Storage
And Why Is Everyone Using Parquet?
Hi, fellow future and current Data Leaders; Ben here 👋
Over the past few months I’ve been writing a series focused on going back to the basics. I’ve covered most of the various steps in an ETL/ELT as well as did some deeper dives into SQL.
Below are the links to the fuller series, but in this article, we’ll be focused on columar storage.
Back To The Basics
Data Pipelines
SQL Basics
With that out of the way, let’s jump into it!
Intro
Data engineers often discuss columnar storage, especially when discussing data warehouses or file formats like Parquet.
But why does it matter?
Why is columnar storage such a big deal for analytics? What makes it so well-suited for analytical use cases compared to other formats?
Maybe you already have a rough idea.
This article will help further explain columnar storage, why it’s used, and how it compares to row-based storage. It will also look at the most common formats and real-world use cases.
Let’s dive in.
What Is Columnar Storage?
To understand columnar storage, it helps to start with how it compares to row-based storage. Most databases don’t really make this distinction obvious; you just run SQL queries and get results. However, in the background, how the data is stored matters.
Let’s break down the difference between row-based and column-based storage.
Row-Based Storage
In row-based storage, data is stored one row at a time.
Imagine a table of customer orders with the following columns: order_id, product, order_date, and amount.
When an end-user places an order, the database inserts all of that data as a single row:

Row-based storage is optimized for transactional systems when you need to quickly read or write a full record. For example, when inserting a new order or updating an existing one.
As that information comes in, it is far more beneficial to store it in a row. That way, it’s quick to insert and update.
Columnar Storage
In columnar storage, data is stored by column instead of row by row.
Using the same order example, a columnar format would store the data like this:
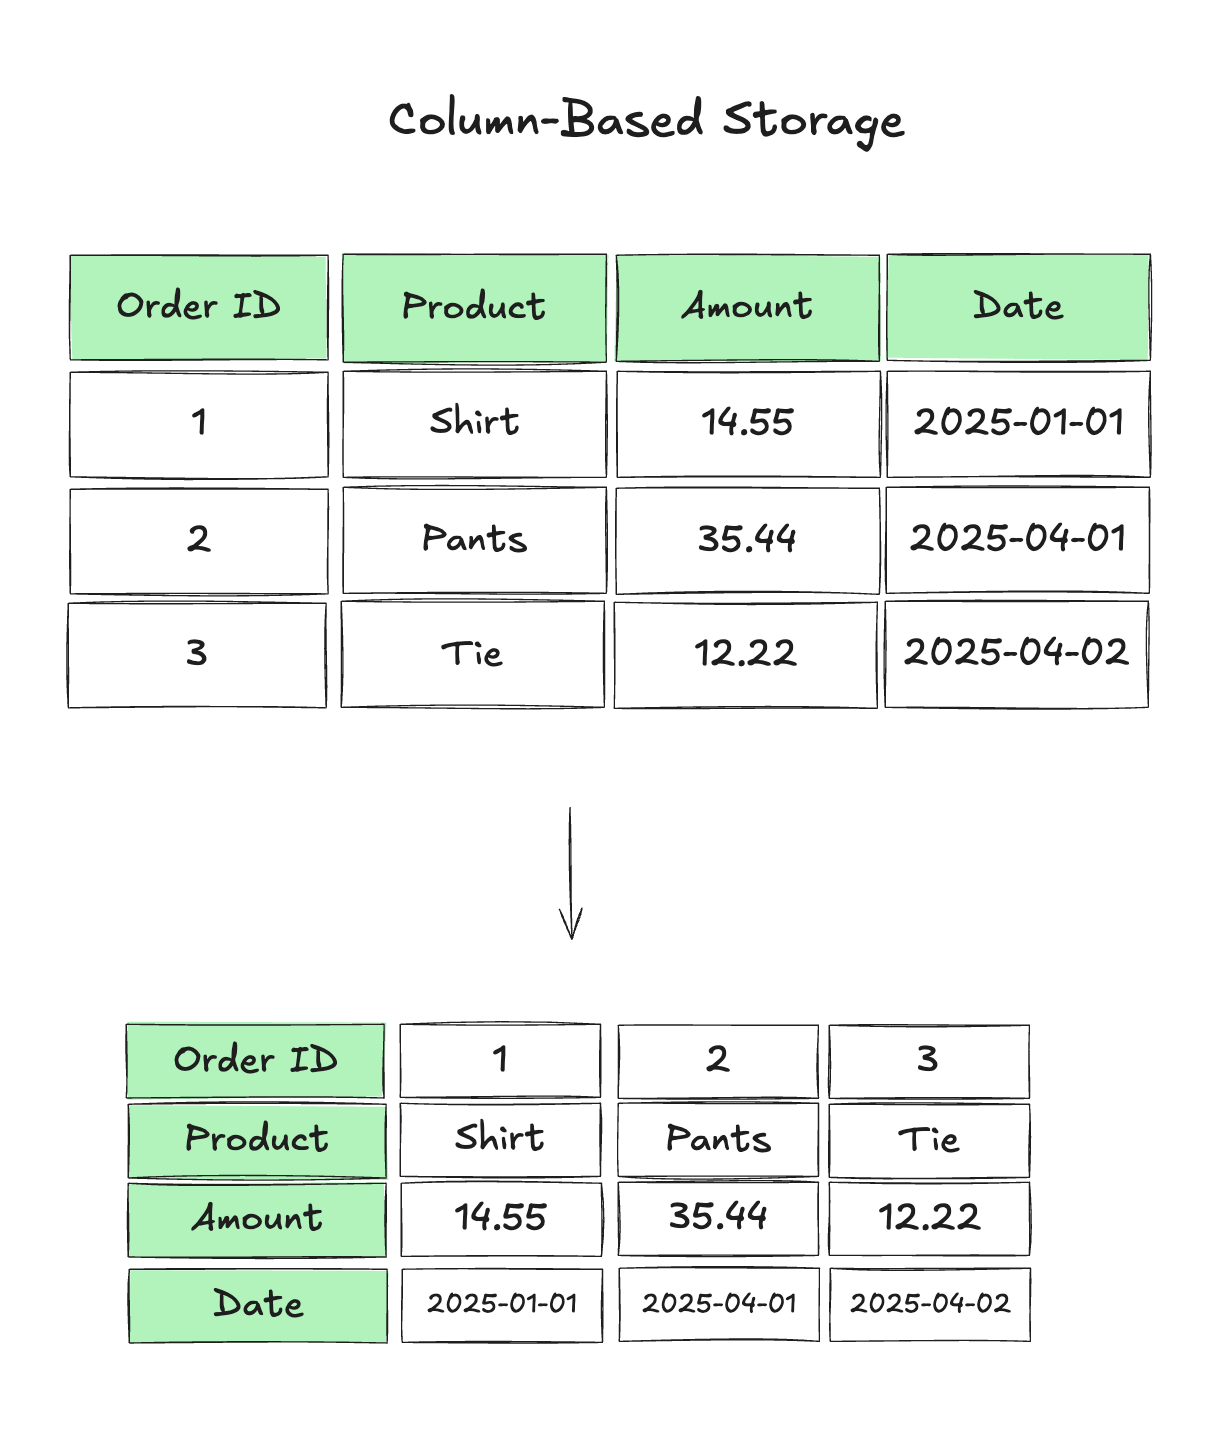
This works great for analytics. When you run queries that aggregate or filter by a few columns (think asking a question like “What’s the average order amount for the past month?”), columnar storage reduces the amount of data scanned and significantly improves performance.
That’s why analytical databases like BigQuery, Vertica, Snowflake, and Redshift are built with columnar storage under the hood.
I remember first really learning about the benefits of columnar storage and compression, for example, when I was digging into Redshift a decade ago. Of course, this begs the question...why?
Why Columnar Storage Matters for Analytics
"Not every data warehouse (OLAP) is necessarily a column store: traditional row-oriented databases and a few other architectures are also used."
- Designing Data-Intensive Applications
DDIA is right; not every OLAP system has to use column storage. I actually got into a slight spat during an interview once when the interviewer insisted all data warehouses must use columnar storage.
That said, there are clear reasons we go through the trouble of using columnar storage formats for analytics. Here’s why it matters.
Performance
One of the goals of analytical queries is to process large swaths of data. Perhaps you want to analyze millions or billions of events. Well, when you run a query that only touches two out of ten columns, you’ll only read the relevant columns(based on your query). That means you scan less data and minimize disk I/O.
In contrast, row-based systems often must read the entire row, even if you only need a single field.
Compression

Because columnar formats store data of the same type together (all order_date values in one block), they compress much more effectively.
Of course, there are multiple methods of compression. Here are a few you might encounter if you look under the hood of your data analytics platform.
Run-Length Encoding (RLE): Stores a repeated value once, along with the number of times it appears consecutively.
Original column: A, A, A, A, B, B, B, C
RLE encoded: (A,4), (B,3), (C,1)
Dictionary Encoding: Builds a dictionary of unique values and stores smaller reference keys instead of the full value. Similar to the image above, but if it helps, you can view it as:
Original column: Red, Green, Red, Blue, Red, Green
Dictionary: {0: Red, 1: Green, 2: Blue}
Encoded: 0,1,0,2,0,1
Bit-Packing: Compresses small numeric values using only the minimum number of bits needed.
Delta Encoding: Stores the difference between consecutive values instead of the full values. Thus, the delta is part of delta encoding.
Vectorized Processing
Columnar storage unlocks a technique called vectorized execution, where operations are applied to batches of column values at once, instead of one row at a time.
This enables query engines (like DuckDB, Presto, and Spark) to use SIMD (Single Instruction, Multiple Data) CPU instructions, which can perform the same calculation across dozens or hundreds of values in a single cycle.
For example, instead of evaluating price > 100 on each row individually, a vectorized engine processes the entire column segment in one shot.
Parallelism
Since each column is stored separately, systems can read multiple columns in parallel.
This is especially valuable with large datasets. Modern architectures can spread the workload across multiple CPU cores or nodes, speeding things up even further.
Common Columnar File Formats
Regarding columnar storage, much of the complexity is abstracted away. If you're using a cloud data warehouse, you’re not interacting with the file format directly; you’re just querying the data.
But under the hood, these formats can make a massive difference in performance and cost. Later in this article, I’ll share an example of where switching compression methods significantly improved a company's query speeds and storage efficiency.
Even if you’re not choosing the file format, these systems rely heavily on columnar storage principles.
That said, when you have control over the format, like when setting up a data lake(house), it helps to know your options. Here are some of the most common ones:
Parquet
Apache Parquet, developed at Twitter and Cloudera in 2013, and was designed to offer a more efficient columnar format for big data analytics. It builds on ideas from Trevni and Google's Dremel paper.
Now if you ever look into the structure of a parquet file, it’ll likely be a little confusing. The term row, column and page get thrown around so you might be wondering what they are all referring to.
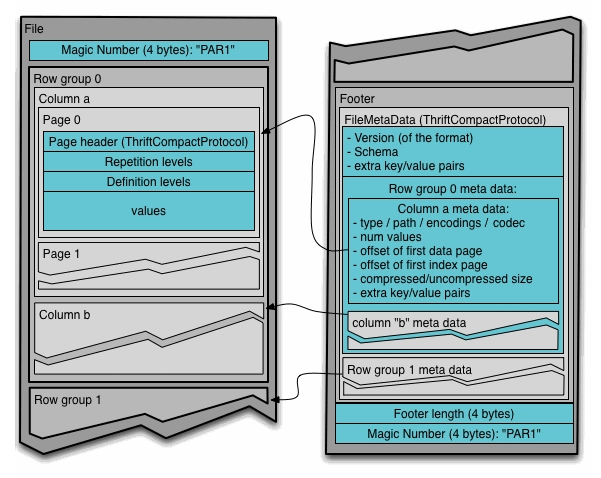
Here are some of the key structural components of a Parquet file:
Row Group – The largest unit of work; a horizontal partition of the data. Each row group contains all columns for a subset of rows.
Column Chunk – A column within a row group. This enables column-wise compression and encoding.
Page – The smallest unit of data storage within a column chunk. Each page is encoded and compressed independently. There are typically:
Data Pages – Contain the actual values.
Dictionary Pages – Used for dictionary encoding if applicable.
Footer – Located at the end of the file; stores metadata like schema, row groups, compression info, and statistics for efficient reads.
These components allow engines like Spark, Trino, and BigQuery to skip over irrelevant data and only read what’s necessary.
Parquet uses a hybrid encoding approach that combines techniques like dictionary encoding, run-length encoding (RLE), and bit-packing to maximize storage efficiency and reduce I/O during reads.
It’s also the most common file format I come across(when a client isn’t just building on top of what their data warehouse provides).
ORC
Apache ORC (Optimized Row Columnar) was built as a Hadoop-native file format focused on deeper compression, efficient storage, and built-in indexing to speed up analytical queries. It became popular with tools like Hive and often outperforms older formats like RCFile.
Similar to Parquet, there are several terms you’ll need to understand if you were to look under the hood of an ORC file.
Stripes – The largest unit in an ORC file. Each stripe contains rows and is independently compressed and indexed.
Row Index – Allows skipping over data blocks that don’t meet query criteria.
Stripe Footer – Contains column-level metadata and statistics like min/max, count, and null values.
File Footer – Stores global metadata including schema definitions, column encodings, and file-level statistics.
Postscript – Contains information about compression algorithms and versioning.
I was also going to write a little bit about Arrow, but since there is some nuance there I am going to hold out for this article. In the future I’ll have to write a deeper article about the actual formats themselves. Because I didn’t even dive into concepts like pages and row groups. Although has a great article on Parquet.
Real-World Use Cases
You should have a good idea of what columnar storage is and why it can be useful. Now let’s see it be useful.
Let’s look at a few real-world examples of companies using Parquet files at scale.
In one case, Uber was already using Parquet and improved performance by switching compression methods. In another, Criteo was processing billions of events per day and migrated to Parquet for better flexibility and efficiency.
Now, before you decide your 100GB or 1TB warehouse needs to switch to Parquet, take a moment. Both of these companies are operating at petabyte scale. The lessons are useful, but the context matters.
Uber Switching To ZSTD For Compression
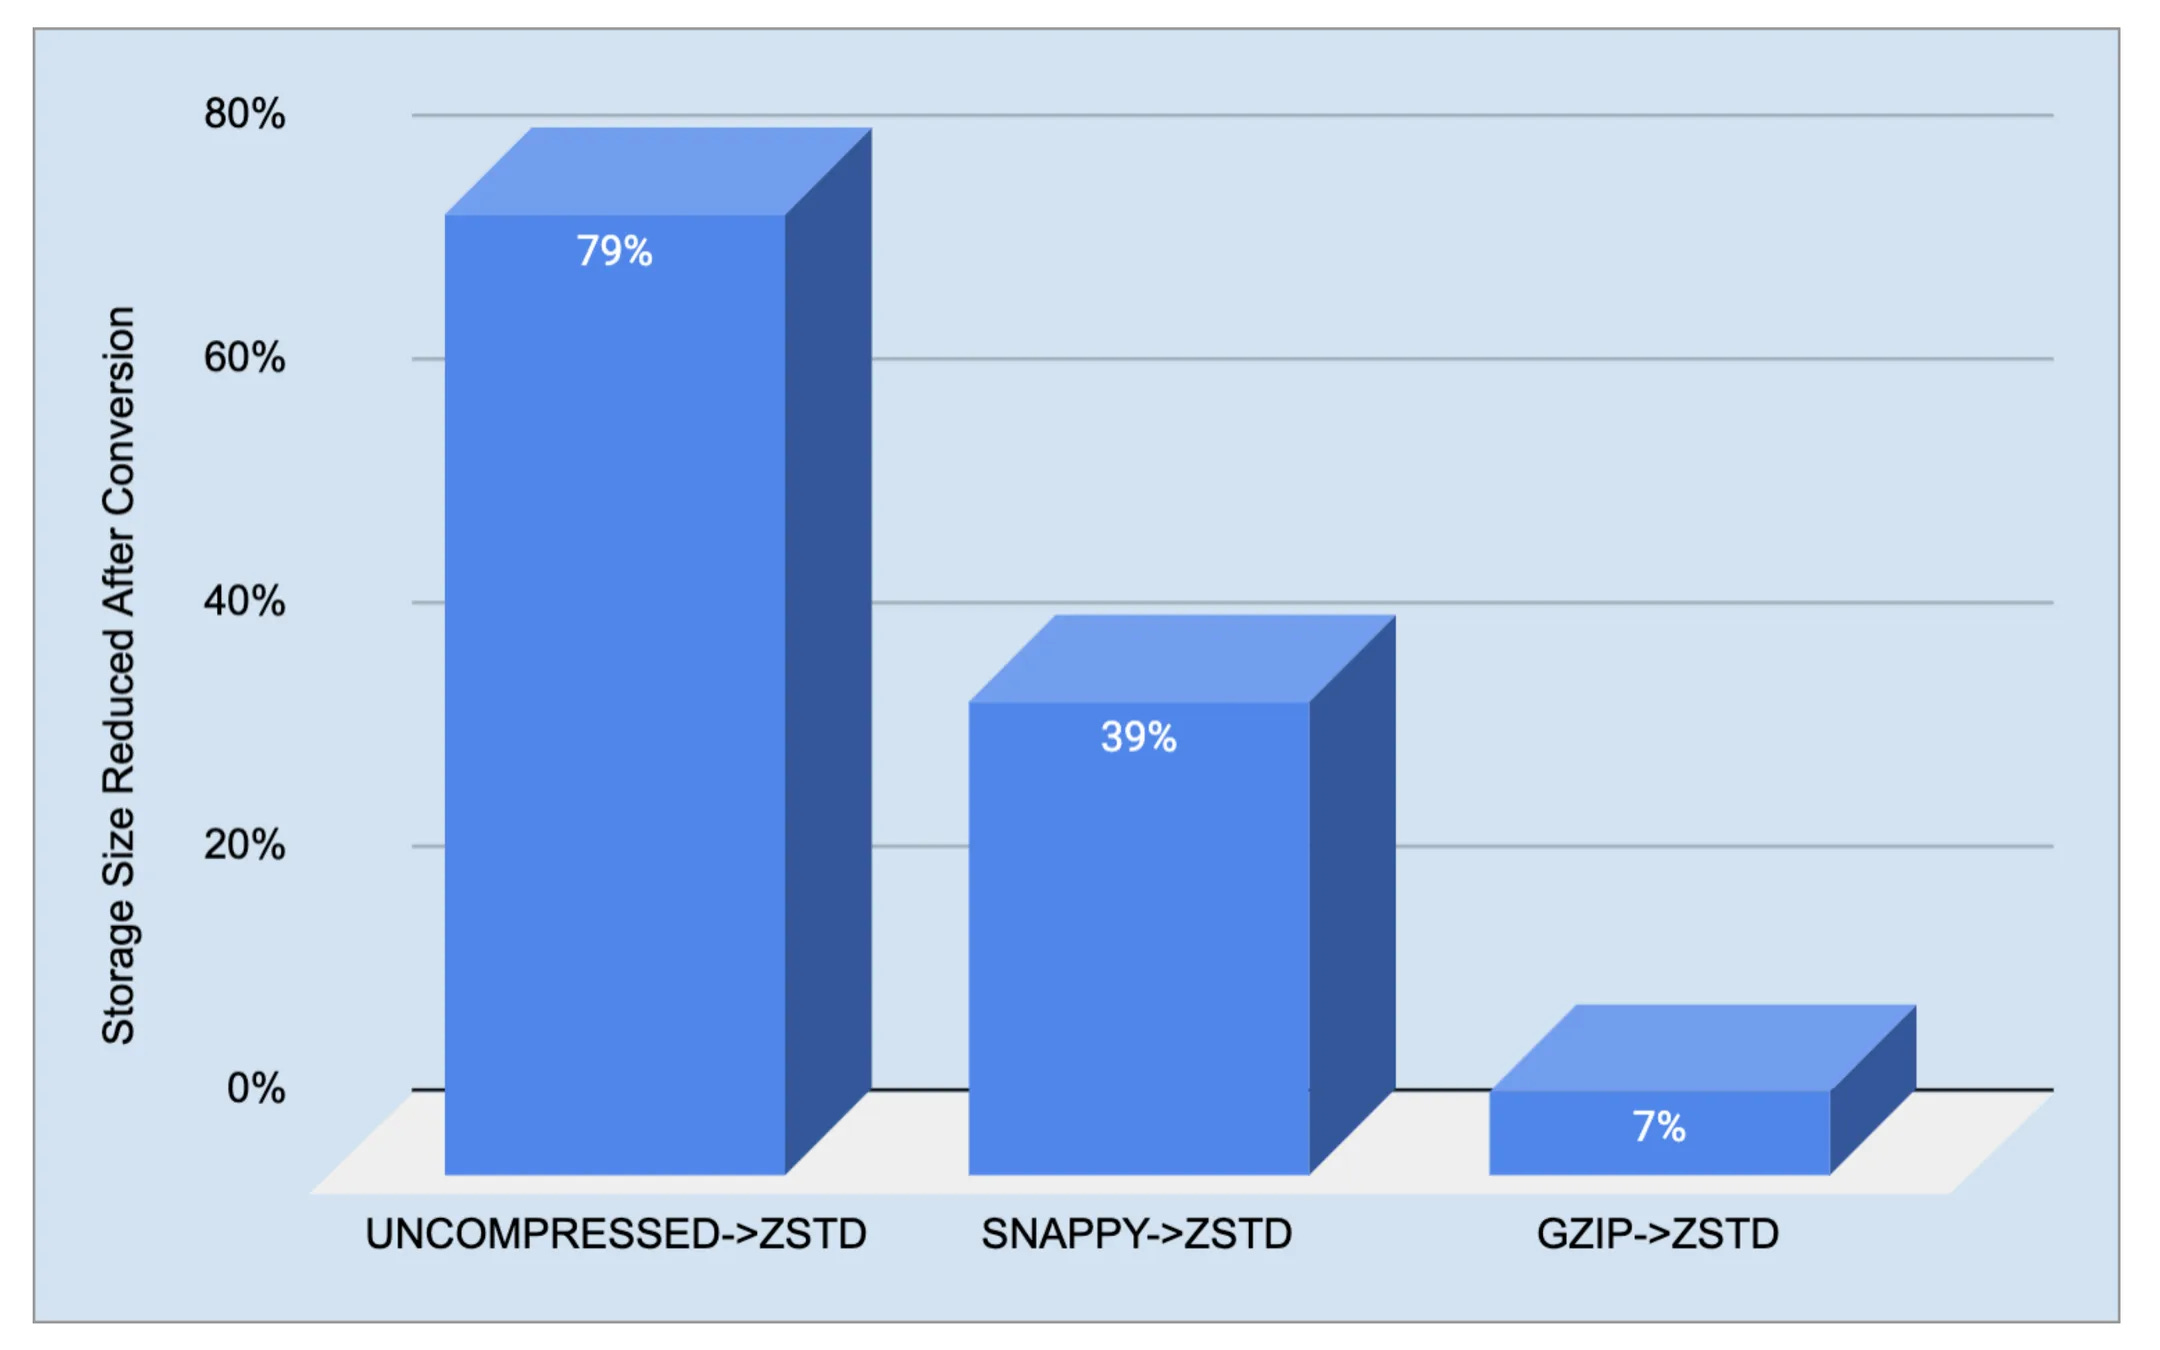
Back in 2022, Uber published a detailed article about how they use Parquet and how switching compression methods helped improve performance.
As you can imagine Uber’s data platform manages hundreds of petabytes, with Apache Parquet as the primary storage format.
As data volumes grew, so did storage and compute costs. To address this, Uber focused on reducing file sizes at the Parquet level. By switching from SNAPPY and Gzip to Zstandard (ZSTD) compression, they achieved up to 39% smaller file sizes and improved query performance by lowering vCore usage.
They also built tools for high-throughput column deletion and column reordering, which allowed them to prune unused fields and optimize encoding.
I for some reason found the quote:
When a table is created, table owners can create whatever columns they want, as there is no governance on that. But some of them might not be used, and those unused columns took a lot of space. We found that just one table after removing unused columns, there were PB level data savings.
Somewhat comical. But perhaps that’s because I know so many companies that could save money and time removing columns, dashboards and other unused data team artifacts.
Overall, the result of this work led to lower storage costs, faster queries, and no sacrifice in data integrity.
Many of those improvements, including ZSTD integration and column pruning tools, were contributed back to the open-source Apache Parquet project.
Parquet Format At Criteo
Criteo, a major player in display retargeting, processes roughly 30 billion events per day and reaches 840 million users monthly, creating massive data processing demands.
Historically, they used RCFile for their Hadoop data but found it deeply tied to Hive and difficult to integrate with their broader stack (Cascading, Pig, Spark, etc.). To improve flexibility and performance, Criteo migrated nearly a petabyte of actively used data from RCFile to Apache Parquet.
Parquet offered better native support across modern processing engines and improved compression, saving substantial storage while maintaining, or even improving, query performance. In their IO-bound cluster, benchmarks showed that Parquet compressed with Gzip matched or exceeded RCFile performance, with added storage efficiency.
By switching to Parquet, Criteo unlocked faster analytics, reduced storage needs, and gained the flexibility to use any compute engine, paving the way for future improvements as they scaled with tools like Impala.
I wonder if they are still using Impala…
Final Thoughts
Columnar storage was built to process analytical queries. Between its ability to compress data efficiently and streamline large-scale processing, it’s easy to see why so many companies lean on it to power their data warehouses and lakehouses.
That said, if your data footprint is relatively small, you can probably get by just fine with your existing setup. Don’t let FOMO push you into rearchitecting just for the sake of using the “latest” infrastructure.
As always, thanks for reading.
The Data Infrastructure Event of The Season is here - OpenXData Conference 2025

Are you curious about the future of open data architectures?
Check out the OpenXData Conference, a free virtual event spotlighting open data architectures, such as Iceberg, Hudi, lakehouses, streaming pipelines, and open query engines like Trino and StarRocks.
You'll hear real-world lessons and insights from data leaders at Netflix, dbt Labs, Databricks, Microsoft, Google, Meta, Peloton, and more.
What to expect:
- Practical advice on building open data platforms
- Talks from the folks actually building and using these systems
When: May 21st - 9am–3pm PDT
Plus: There is a live Airpod Max giveaway if you tune in!
Articles Worth Reading
There are thousands of new articles posted daily all over the web! I have spent a lot of time sifting through some of these articles as well as TechCrunch and companies tech blog and wanted to share some of my favorites!
From Analytics to Data Science: Building Forecasts
By
Forecasting is one of the most over-discussed topics in data science, and yet it’s still hard to get right. It’s one thing to build a model for Kaggle, but it’s entirely different to deploy it in a real business or product context and fine-tune it while accounting for anomalies, seasonality, external factors, ad spend fluctuations, new feature rollouts, and a hundred other variables we’re expected to quantify
This publication is a follow-up to Forecasting in Analytics: Choosing the Right Approach, published a few weeks ago, where I introduced different types of forecasts and ML models, as well as common use cases for predictive modeling in analytics. I went over common financial and revenue forecasts, including methods like:
Bridging the Gap - A Data Leader’s Guide To Helping Your Data Team Create Next Level Analysis

One of the biggest challenges data leaders have mentioned to me over the past couple of weeks?
End Of Day 178
Thanks for checking out our community. We put out 4-5 Newsletters a month discussing data, tech, and start-ups.
Love the Back to the Basics content! Another super helpful entry in the series
The best explanation of columnar storage and why it is used :)