
Understanding the “T” in ETL: A Back-to-Basics Guide to Data Transformations
Over the past year, I’ve been writing about several back-to-the-basics topics, like extracting data via APIs and SFTP, and building solid data models. But I realized I hadn’t yet touched on the “T” in ELT/ETL: transformations.
And that’s where data and analytics engineers often spend a lot of their time, whether it’s standardizing inputs or layering in business logic.
So in this article, I’ll break down what transformations are, why they matter, and walk through a few examples.
What is Transform, Anyway?
For a long time, most tools handled extract, transform, and load together, no real separation between them. Either that or a developer would manually put together a set of stored procedures that would be run via a cron job and have extracts programmed for APIs, databases and SFTP.
But what really happens during transform step?
The answer depends on your stack and use case, but at a high level, the T exists to solve a few core problems.
Business Logic - This type of transform is usually focused on rules and definitions that make the data useful to the business. For example it might be used to deal with returns and purchases for a retail company as the data might be in different tables or perhaps returns are only flagged in a field but the actual value of the return is positive. Meaning you’ve got to create a process to accurately calculate the total amount purchased.
Standardization - Every system has its own naming conventions, date formats, IDs, and categories. As you’re building your data model, you’ll want to standardize them. In fact, this was one of my first projects at Facebook. It makes it far easier for future users to work with data that has the same set of categories and naming conventions.
Data Integration -One of the major goals of a data warehouse is to provide a way for end-users to join data sets from different sources. That means you might want to join your CRM data to billing and ERP data. But usually there isn’t a magic way to do so. You’ll have to either integrate systems on the application layer or in the data warehouse. Some where, an ID of sorts will need to be created that lets you join all the information.
Pre-Aggregation - If you’re calculating metrics at scale, it’s often more efficient to pre-aggregate the data. That way when end-users want to query said data, it doesn’t take minutes for the dashboard to load.
How We Used To Handle Transform (And Often Still Do)
Before the rise of modern tooling, transforms were either a homegrown system that engineers built or an out of the box low-code/drag-and-drop tool. Think SSIS.
Here’s what a homegrown solution might entail.
Stored procedures or SQL scripts in your data warehouse
Python or Bash scripts to execute them
Cron jobs, Task Scheduler, SQL Server Agent, Jenkins, pick your scheduler poison
Honestly? Plenty of companies are still running pipelines like this today.
And it works, but it often comes with limitations depending on how the engineers set it up.
For example, you might not have an easy way to integrate your stored procedures with version control. At one of the first companies I worked at we had to both push our code into the repo and then manually change it on the database.
So it was from fluid, and there is a risk that you might push different code to both locations.
The Rise of Transform-Focused Tools
Enter tools like dbt.
dbt wasn’t the first transform tool, there were plenty of earlier platforms, often with drag-and-drop UIs and some SQL sprinkled in. But it’s hard to deny the fact that many companies have started to use dbt. Especially at start-ups during the MDS boom of the early 2020s.
It stood out because it:
Embraced version control, modular SQL, testing, and documentation
Made SQL-based workflows accessible to a broader set of users
I do want to make sure it’s known that there are other tools such as SQLMesh and Dataform, so you aren’t limited to just dbt if you’re looking for a SQL based transform tool.
Common Types of Transforms
Now that we’ve talked about why the transform step matters, let’s look at the what. What do some transforms look like?
To answer that question I have a few examples below.
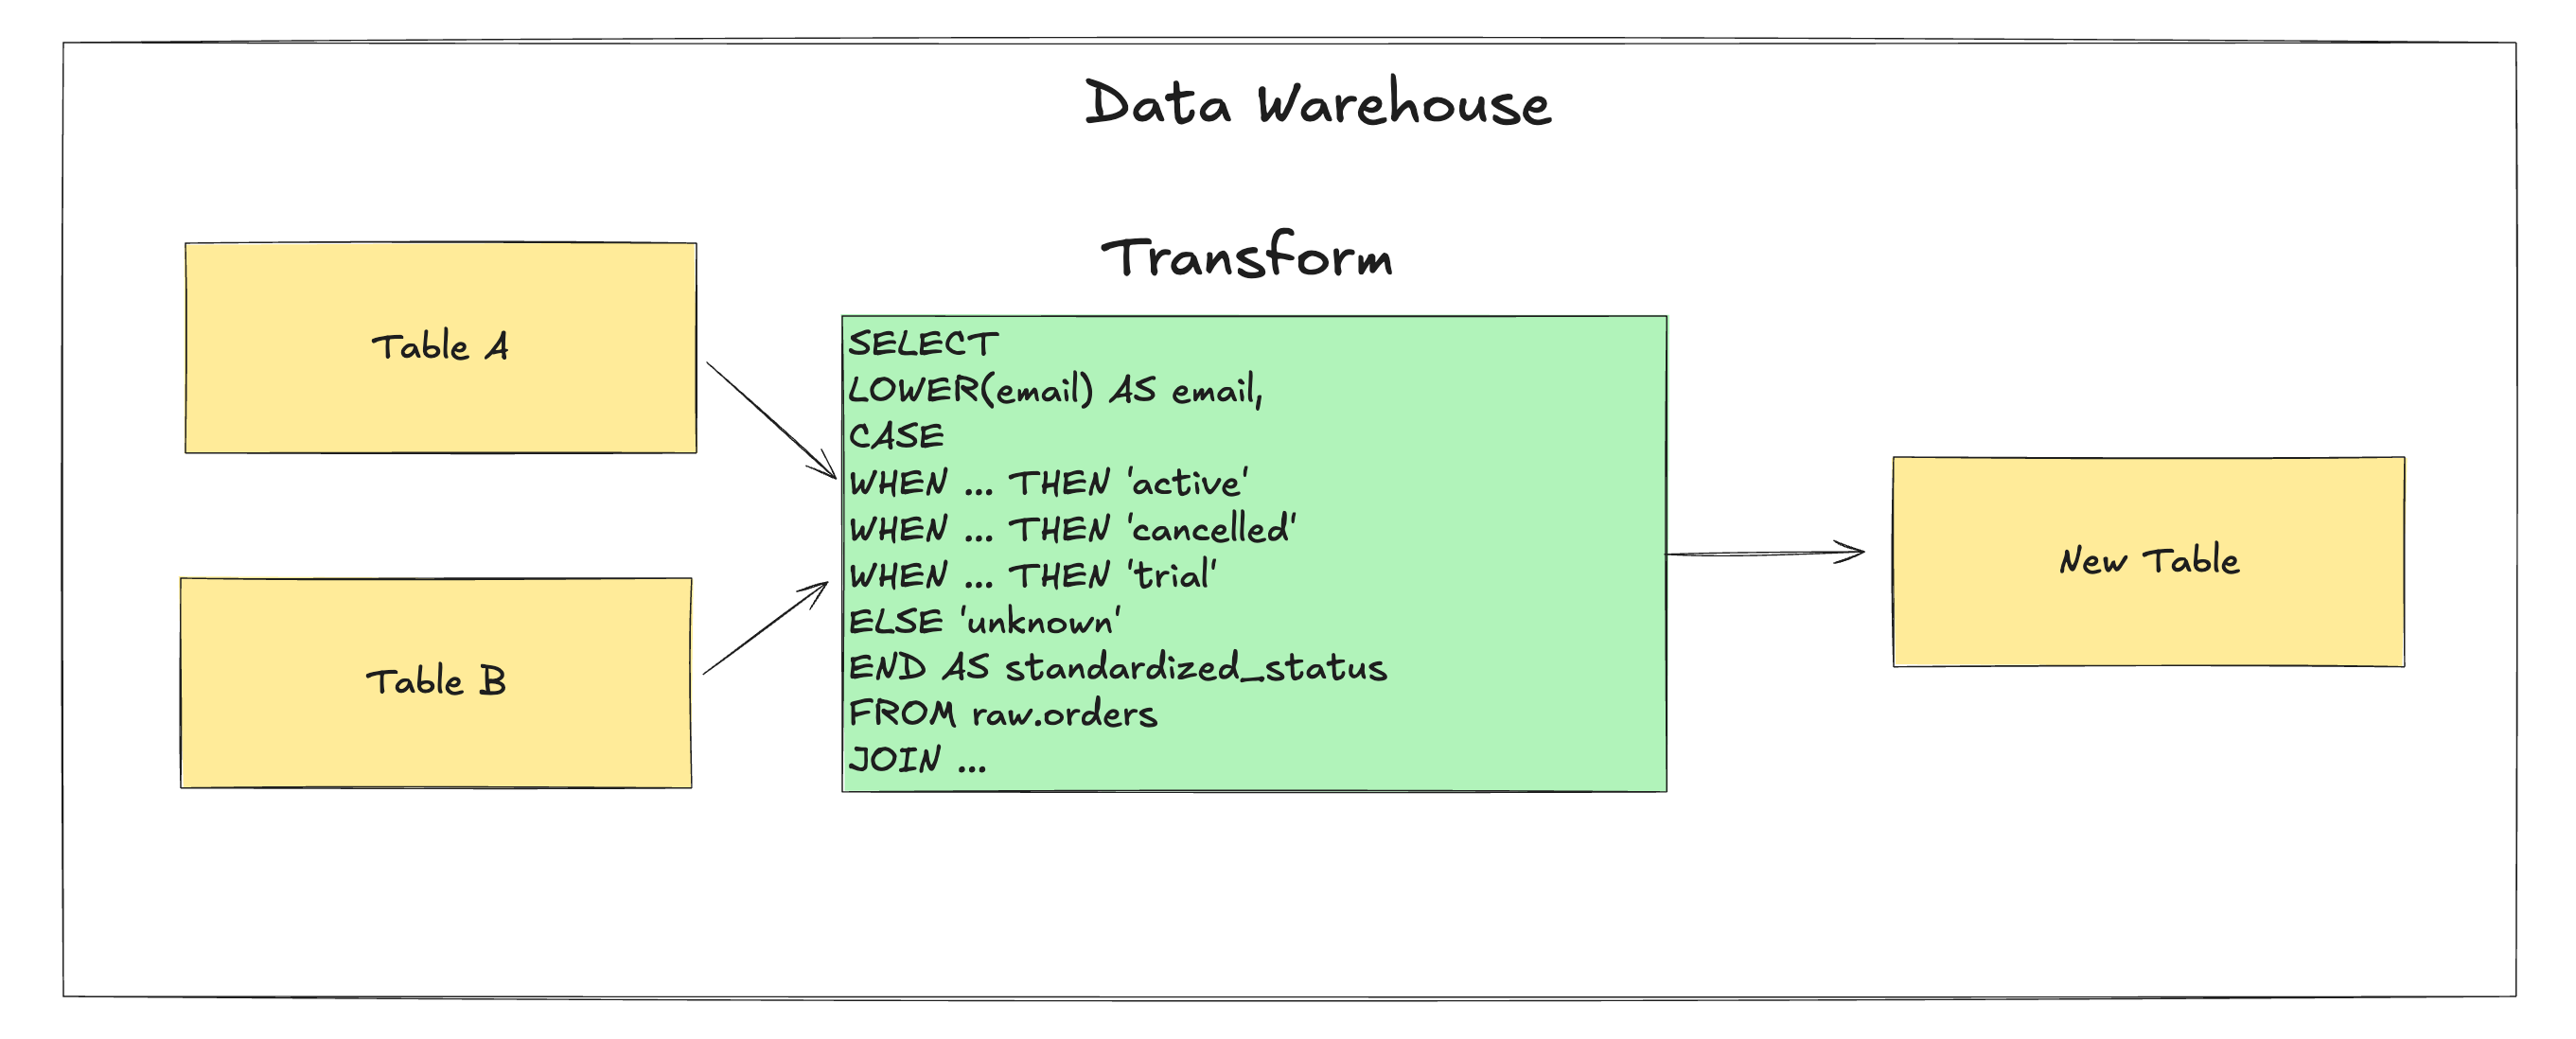
Value Standardization (Using CASE)
Sometimes, systems use different labels or categories for the same concept, and you need to standardize them into a single value. A quick way to do this is with a CASE statement, this is ok when you have a few categories.
But if you’re dealing with hundreds of values, a lookup table may be the better long-term strategy.

Say different systems record subscription statuses as shown below.
System A: active, cancelled, trial
System B: ACT, CXL, TRIAL_PERIOD
You can standardize them with a CASE statement as shown below.
CASE
WHEN status IN ('active', 'ACT') THEN 'active'
WHEN status IN ('cancelled', 'CXL') THEN 'cancelled'
WHEN status IN ('trial', 'TRIAL_PERIOD') THEN 'trial'
ELSE 'unknown'
END AS standardized_status
This ensures downstream metrics and filters work consistently across dashboards, regardless of the original source format.
Data Type Standardization
Data from APIs or SFTP might not come in the format we’d like, numbers as strings, dates as text, and booleans as "Yes"/"No" strings.
That’s why we will clean that up via standardizing and ensuring all of them match what we’d expect. That way we don’t have five different date formats in our data warehouse.
So here is an example of how you’d convert values to a standard format.
SELECT
CAST(order_total AS NUMERIC) AS order_total,
CAST(order_date AS DATE) AS order_date,
LOWER(email) AS email
FROM raw.orders
Another example would be turning text-based booleans into actual booleans.
CASE
WHEN is_active = 'Yes' THEN TRUE
WHEN is_active = 'No'
THEN FALSE ELSE NULL
END AS is_active
Categorizing Values For Reporting
Often times for reporting purposes or perhaps segmentation, you might add in categories that are not included in your current data set. For example, in the query below we are marking “high_value” customers.
This probably doesn’t exist in your POS, but could be helpful for reporting.
You might also want to create a list of certain customers with attributes for retargeting or special promotions which could also be added in.
WITH recent_spending AS (
  SELECT
    customer_id,
    SUM(order_amount) AS total_spent
  FROM orders
  WHERE order_date >= DATEADD(MONTH, -6, CURRENT_DATE)
  GROUP BY customer_id
)

SELECT
  customer_id,
  total_spent,
  CASE
    WHEN total_spent >= 1000 THEN 'high_value'
    ELSE 'regular'
  END AS customer_segment
FROM recent_spending;
There are still plenty of other transforms but that should give you an idea.
Challenges With The Transformation Step
Even with tooling like dbt, you’ll run into issues. If you're not careful, the "T" layer can end up just as messy as the raw data it was supposed to clean up.
Here are some of the common challenges data teams run into.
3000 Line Queries
Transform models often grow organically. Someone needs a metric, so they tack on another CTE or join. Repeat that a few dozen times, and suddenly, you’re dealing with a 3000-line SQL file, 17 CTEs deep, with a bunch of CASE WHEN logic buried in subqueries.
It technically works, but nobody wants to touch it.
Dependency Sprawl
The more models depend on each other, the more fragile things become. Small upstream changes can ripple downstream and break dashboards in ways that aren’t obvious until someone complains.
Without clear lineage or dependency mapping, you risk creating a fragile system that’s easy to disrupt and hard to fix.
Lack Of Ownership
In this move fast data world, many different types of data specialists might get involved in creating transforms data engineers, analytics engineers, and even analysts. But who owns the definitions? Who’s responsible for cleaning up deprecated models? Who gets the final say on business logic?
If you don’t have clear ownership, in the long-run that speed will bite.
Patterns for Organizing Your Transform Layer
To avoid chaos, your transform logic needs structure. Now when I started in the data world we used “raw”, “stage”, “prod”. Although “prod” really wasn’t a great name if you’re also using a dev and prod set-up for deploying code.
Recently, two different approaches essentially co-opted and renamed those layers and you’ve probably come across them either because you’ve worked with dbt or read about the medallion architecture.
Just so you have a general idea, here is how the medallion architecture breaks down.
Medallion Architecture
Popularized by Databricks, the medallion architecture uses a similar three-layer approach as has been done for a while. I do often find that one of it’s biggest advantages is the naming generally makes it easier for the business to understand what the data team is talking about.
Bronze - Raw or minimally cleaned data from source systems. Equivalent to raw tables where the data is left “as-is”.
Silver - Standardized and enriched data, sometimes combining multiple bronze sources. “The Silver layer brings the data from different sources into an Enterprise view and enables self-service analytics for ad-hoc reporting, advanced analytics and ML” - Databricks
Gold - Business-level aggregates and reporting tables, the tables powering dashboards, KPIs, and executive reports or as Databricks puts it “consumption-ready "project-specific" databases”
Other Considerations
As you’re building and running your transform layer, there are a few other key considerations to keep in mind.
Data Quality - Each transform and SQL script is another opportunity to introduce errors. Unit tests and data quality checks aren’t just nice to have, they’re essential for catching issues before they hit production.
Ownership -Tools like dbt have broadened who can build layers in your data platform, which is great for speed and collaboration, but it also blurs the line of responsibility. Where does ownership of the core data warehouse end, and where do use case-specific layers begin? Without clear boundaries, things can get messy fast.
Developer Experience - How easy is it to safely develop and test changes? I recently ran into a situation where the only way to push updates was straight to production, no staging, no review. That might be fine for a solo project, but in a shared environment with multiple dependencies, it’s a recipe for broken pipelines.
Final Thoughts
Transforms are a critical piece of your data pipeline. It’s where raw data gets processed, standardized, integrated, and turned into something more accessible to end users like analysts.
It’s also where business logic gets applied, systems get stitched together, and analysts get the tables they actually want to work with.
Whether you’re building in SQL with dbt, scripting in Python, or using a low-code platform, your transform layer deserves real thought and structure. When done right, it becomes a foundation you can trust.
As always, thanks for reading!
Worried About Your Snowflake Bill?

Espresso AI is a data warehouse optimization tool for Snowflake. We are a team of ex-Google performance engineers leveraging our ML models’ understanding of SQL to:
Optimize individual queries on the frontend
Optimally allocate physical compute on the backend
The result is an instant, significant reduction in Snowflake spend.
💸Early customers are seeing savings of up to 70% on their Snowflake bill.
Want to know how much we could save you?
Thanks Espresso AI for sponsoring this newletter!
Upcoming Member Events
I have been working to add more and more value to the Seattle Data Guy Newsletter. As part of that, I’ve been running member webinars!
Here are the next three I have planned!
Breaking Into Data Consulting - From Marketing To Positioning - April 23rd, 9 AM MT
Dimensional Data Modeling Fundamentals - April 24th, 9 AM MT
If you’d like to be invited, then consider supporting the newsletter below!
Join My Data Engineering And Data Science Discord
If you’re looking to talk more about data engineering, data science, breaking into your first job, and finding other like minded data specialists. Then you should join the Seattle Data Guy discord!
We are now over 8000 members!
Join My Technical Consultants Community
If you’re a data consultant or considering becoming one then you should join the Technical Freelancer Community! We have over 1500 members!
You’ll find plenty of free resources you can access to expedite your journey as a technical consultant as well as be able to talk to other consultants about questions you may have!
Articles Worth Reading
There are thousands of new articles posted daily all over the web! I have spent a lot of time sifting through some of these articles as well as TechCrunch and companies tech blog and wanted to share some of my favorites!
7 Lessons I Learned the Hard Way From 9+ Years as a Data Engineer
Reflection is an essential part of the learning process.
Learning, whether as a data engineer, analyst, or really any position, is not just about cramming as much knowledge into your head as possible; it’s about pausing to consider why certain knowledge matters and how it can be applied. Without that step, knowledge becomes a tool in your workshop that never gets used.
Sure, you can show off that cool tool or share quirky, one-off facts. It might seem impressive, but it doesn’t carry much weight. Taking time to reflect helps you understand where technical knowledge fits and what lessons you’ve genuinely absorbed over the past year, or even the last decade. Where have you made mistakes in picking the wrong data modeling processes or running the wrong project altogether? Many of these lessons have to be learned through time and making mistakes.
Here are some of the most important lessons I’ve learned about working with data and building effective systems.
How To Develop Analytical Intuition
by
Have you ever wondered why so many companies, when interviewing for analytical roles, ask sampling questions like:
How many dentists are in the world?
How many M&Ms can you fit in a jar?
How many cars are there in the US?
How many photos are taken at the Eiffel Tower in a day?
They’re not asking these questions to make fun of your misery - they’re testing your analytical intuition.
In addition to having SQL and Python skills, wearing the analyst hat requires critical thinking and the ability to arrive at the answer or spot an error without much context or research.
End Of Day 175
Thanks for checking out our community. We put out 4-5 Newsletters a month discussing data, tech, and start-ups.
Nice article.
I am a beginner but I read with using the some ai to understand to the ground.
Thanks for your effort to write this article.
With the T layer. A big challenge I see are efficient incremental update for the semantic layer / model refresh. If we are ending in an E(tltltltl)L, how to burn less ressources and reduce de bill?